
When Crayon published the first edition of the State of Competitive Intelligence on January 16, 2018, “Despacito” was still comfortably in the Top 40. You had just heard the term “Bitcoin millionaire” for the very first time. The New England Patriots were better at football than the Kansas City Chiefs.
My point is that the State of CI has been around a while. It is, by far, the longest-running benchmark report in the industry, the source of truth for anyone who wants to understand why and how companies create competitive intelligence programs.
Today, we published the 6th edition of the State of CI, rich with insights from a survey of 900 CI leaders and stakeholders. You can download it here.
Like I said: The report is rich with insights. To ensure you don’t miss the top insights, here’s what you need to know:
- For the average software company, 66% of sales opportunities are competitive.
- Your stakeholders value relevance and accessibility over everything else.
- Since 2018, we’ve seen a 125% increase in the share of CI programs with key performance indicators (KPIs).
1. For the average software company, 66% of sales opportunities are competitive.
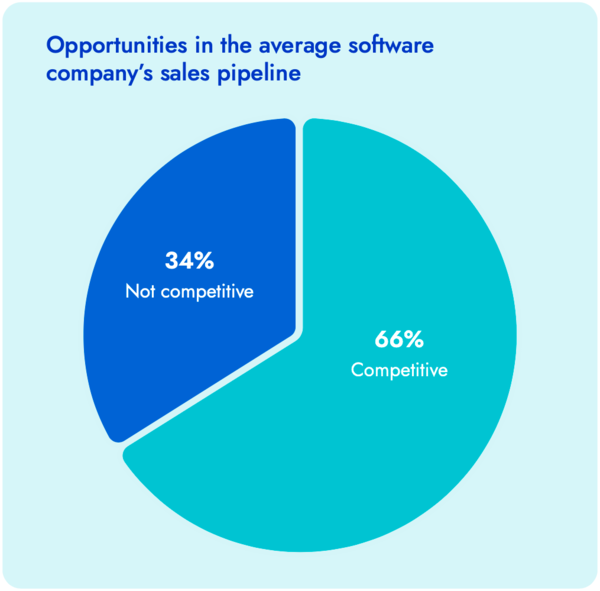
Why you should care: If you want to create a CI program—i.e., formally dedicate resources to capturing, analyzing, and distributing competitive intelligence—you need to earn the support of a decision-maker. This statistic can help you do that. Include it in your business case.
2. Your stakeholders value relevance and accessibility over everything else.
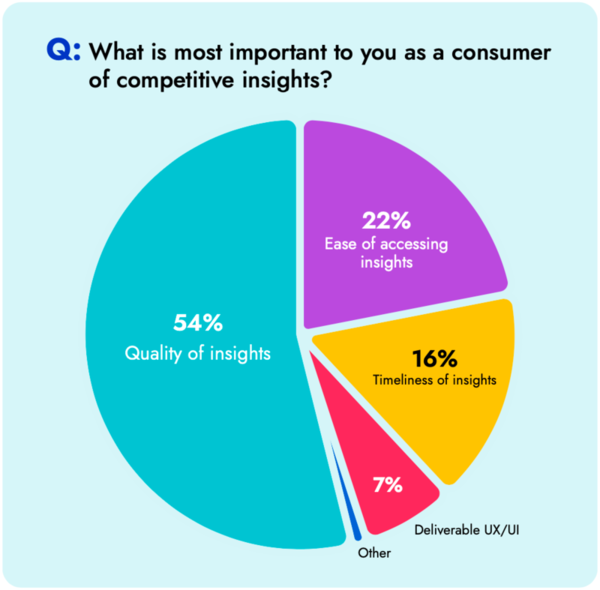
Why you should care: The success of your CI program depends on your stakeholders. If they use the insights you give them, the program is a success; if they don’t, it’s a failure. The chart you see above tells a clear story: Insights need to be relevant and easy to access. Your program will not succeed unless you meet both of those requirements.
3. Since 2018, we’ve seen a 125% increase in the share of CI programs with key performance indicators (KPIs).
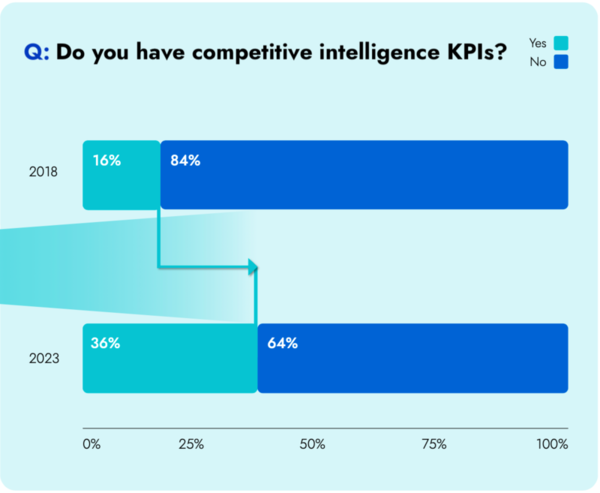
Why you should care: The tech world has been dealing with macroeconomic pressures for a while now, and that will likely remain the case throughout 2023. Your finance team is scrutinizing everything. Investments that don’t show clear returns will be cut. The good news for you is that, evidently, you can show returns on the investment in a CI program. Download the full State of CI report to find out which KPIs your peers are using to show their finance teams that CI is critical.
Tune into the State of CI webinar on Monday March 20 to hear expert analysis of all the top insights
At 1pm Eastern on Monday March 20, we’re sitting down with CI leaders from Akamai and Deltek to get their takes on the top insights from the State of CI. Save your seat now!

Seeing is believing! Check out Crayon for yourself.

Related Blog Posts
.png?width=500&name=Sales%20Enablement-What%20is%20SE_%20(2).png)


Popular Posts
-
 Sales Battlecards 101: How to Help Your Sellers Leave the Competition In the Dust
-
 How to Create a Competitive Matrix (Step-by-Step Guide With Examples + Free Templates)
-
 The 8 Free Market Research Tools and Resources You Need to Know
-
 6 Competitive Advantage Examples From the Real World
-
 6 Exceptional Brand Messaging Examples We Can All Learn From