
If you’re responsible for competitive enablement, you should survey your sales reps on a quarterly basis and ask them how confident they feel selling against your top competitors.
Their responses will help you make better use of your time. The less confident your reps feel about a certain competitor, the more time you should spend educating them on that competitor (assuming it’s a legitimate threat).
But survey data, on its own, can be misleading. Social desirability bias suggests that some reps may exaggerate their confidence levels, even if the survey is anonymous.
That’s why I recommend supplementing your survey data with a metric that I call battlecard views per competitive deal.
Here’s how it works. Let’s say you compete with a company called Acme. In the last 90 days, your sales team has gone head-to-head against Acme in 25 deals and they have viewed your Acme battlecard 50 times.
50 ÷ 25 = 2. That’s 2 battlecard views per competitive deal against Acme.
Now let’s look at another competitor: Hooli. In the last 90 days …
- 20 deals
- 60 battlecard views
60 ÷ 20 = 3. That’s 3 battlecard views per competitive deal against Hooli. Evidently, when your reps are selling against Hooli, they’re more inclined to view the battlecard.
Why? Probably because they feel less confident about Hooli than they do about Acme. I have data (from a small sample size) to back this up. It requires some explaining, so bear with me.
First, I randomly selected 10 Crayon customers and calculated battlecard views per competitive deal for each of their top 5 competitors. Here are the numbers for one customer:
- Competitor 1: 125 battlecard views ÷ 65 deals = 1.92 battlecard views per deal
- Competitor 2: 62 battlecard views ÷ 32 deals = 1.94 battlecard views per deal
- Competitor 3: 94 battlecard views ÷ 28 deals = 3.36 battlecard views per deal
- Competitor 4: 68 battlecard views ÷ 28 deals = 2.43 battlecard views per deal
- Competitor 5: 69 battlecard views ÷ 19 deals = 3.63 battlecard views per deal
Note that the competitors are numbered based on volume of deals. In the last 90 days, this Crayon customer went head-to-head against Competitor 1 in 65 deals. By comparison, they went head-to-head against Competitor 5 in only 19 deals.
After doing all this math for 10 customers, I calculated the averages:
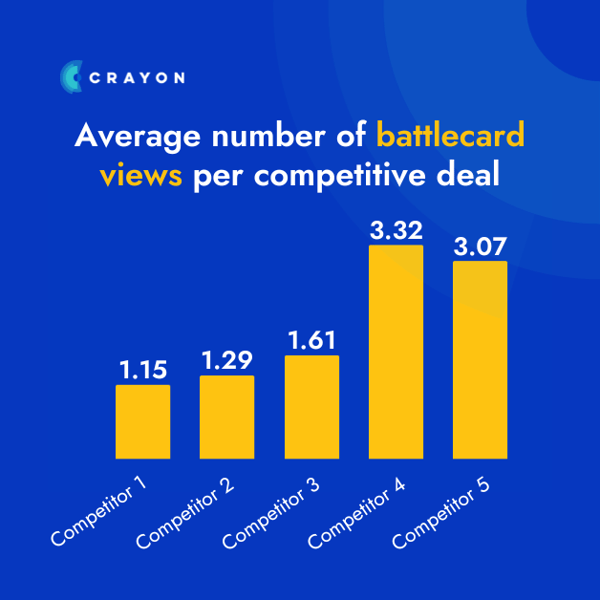
There seems to be a correlation: The less often your reps see a certain competitor, the more they rely on your battlecards—which makes sense. Fewer at-bats = lower confidence = greater reliance on battlecards.
I’ll wrap up by returning to my original point: Take your confidence surveys with a grain of salt. Some reps may be reluctant to admit just how little confidence they have in certain situations. By calculating battlecard views per competitive deal, you can see how honest they’re being.

Seeing is believing! Check out Crayon for yourself.

Related Blog Posts
.png?width=500&name=Sales%20Enablement-What%20is%20SE_%20(2).png)


Popular Posts
-
 Sales Battlecards 101: How to Help Your Sellers Leave the Competition In the Dust
-
 How to Create a Competitive Matrix (Step-by-Step Guide With Examples + Free Templates)
-
 The 8 Free Market Research Tools and Resources You Need to Know
-
 6 Competitive Advantage Examples From the Real World
-
 6 Exceptional Brand Messaging Examples We Can All Learn From