
Being a CI team of 1 in a saturated market is a tough job. Ideally, you'd like to keep tabs on every competitor, but you don't have nearly enough bandwidth to do that.
You need to prioritize. You need to focus on the competitors that matter most.
How do you identify those competitors? You use the Competitor Coefficient.
How to prioritize your competitors using the Competitor Coefficient
The Competitor Coefficient is a number that represents the threat a competitor poses to your company's revenue. The higher the number, the greater the threat. The calculation is simple.👇
Competitor Coefficient = % of opps where Competitor X was involved ÷ win rate against Competitor X
Here's an example using made-up numbers:
👉 Total number of Q2 sales opps: 100
👉 Number of Q2 sales opps where Competitor X was involved: 50
👉 Q2 win rate against Competitor X: 5%
✅ Competitor X coefficient = 0.5 ÷ 0.05 = 10
On its own, this number doesn't tell us anything. So let's calculate the coefficient for Competitor Y:
👉 Number of Q2 sales opps where Competitor Y was involved: 50
👉 Q2 win rate against Competitor Y: 10%
✅ Competitor Y coefficient = 0.5 ÷ 0.1 = 5
Aha! Now we're getting somewhere. Competitor X is a greater threat to revenue than Competitor Y. For good measure, let's calculate the coefficient for Competitor Z:
👉 Number of Q2 sales opps where Competitor Z was involved: 20
👉 Q2 win rate against Competitor Z: 10%
✅ Competitor Z coefficient = 0.2 ÷ 0.1 = 2
To recap our calculations:
✅ Competitor X coefficient = 10
✅ Competitor Y coefficient = 5
✅ Competitor Z coefficient = 2
Competitor X is a greater threat than Competitor Y; Competitor Y is a greater threat than Competitor Z.
Boom. You just prioritized your competitors. 👊
How to visualize your top 10 competitors using the Threat Thermometer
Once you've calculated the coefficient for each of your competitors, I recommend creating an image to visualize the top 10, ranked from highest coefficient to lowest coefficient. Not only does this make it easier to keep track of your priorities, but it also allows you to segment your top 10 competitors into tiers, each with its own set of activities and deliverables.
For example, I created the Threat Thermometer:
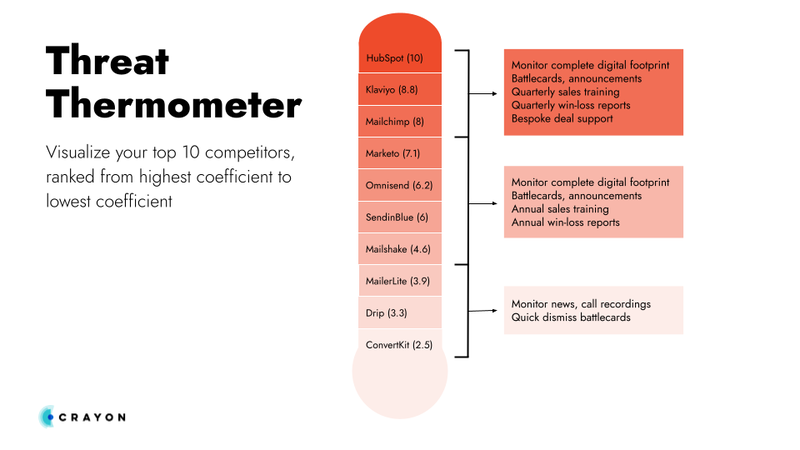
Feel free to either use the Threat Thermometer for yourself or to create a similar visualization of your own! As long as it's based on your competitor coefficient data and it makes your life easier, you're doing it right. 👍

Seeing is believing! Check out Crayon for yourself.

Related Blog Posts


Popular Posts
-
 Sales Battlecards 101: How to Help Your Sellers Leave the Competition In the Dust
-
 How to Create a Competitive Matrix (Step-by-Step Guide With Examples + Free Templates)
-
 The 8 Free Market Research Tools and Resources You Need to Know
-
 6 Competitive Advantage Examples From the Real World
-
 6 Exceptional Brand Messaging Examples We Can All Learn From