
It’s that time again: the monthly marketing staff meeting where the growth team, content team, web team—you get the idea—will showcase their latest metrics. How are our efforts in these respective areas moving the needle?
If you’re in a product marketing and/or competitive intelligence role, you may not have as many bar charts as everyone else, but measuring KPIs against the work you’re doing is happening in some form or another—and it’s happening more frequently.
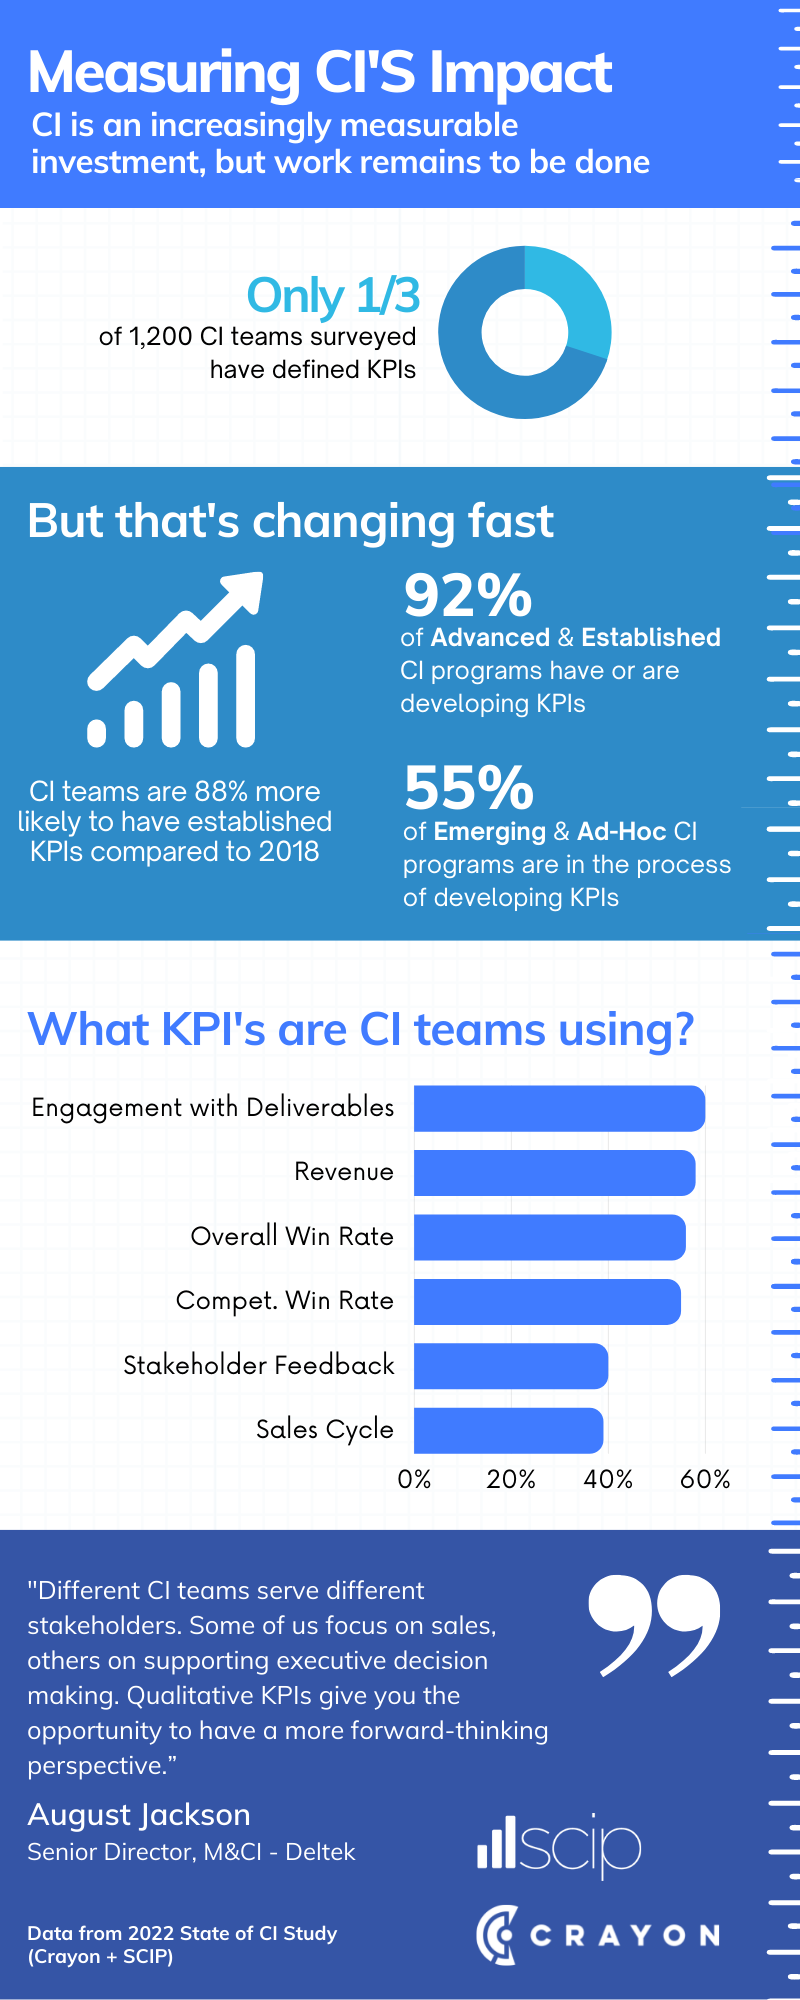
Below is an infographic from our partners at SCIP, outlining recent data from the 2022 State of Competitive Intelligence Report. In the report, we found that teams are increasingly focused on KPIs to measure the effectiveness of CI. In fact, since 2018, we’ve seen an 88% increase in the number of CI teams using defined KPIs. Even more encouraging: Of the teams not currently using defined KPIs, 74% of responding companies mentioned they have started the measurement process. It’s fairly clear that CI measurement is on everyone’s radar.
Want to learn more about the recent findings from the State of CI report? Join us on Wednesday March 16th for a webinar where we’ll cover CI KPIs and more! Register here.

Seeing is believing! Check out Crayon for yourself.

Related Blog Posts
.png?width=500&name=Sales%20Enablement-What%20is%20SE_%20(2).png)


Popular Posts
-
 Sales Battlecards 101: How to Help Your Sellers Leave the Competition In the Dust
-
 How to Create a Competitive Matrix (Step-by-Step Guide With Examples + Free Templates)
-
 The 8 Free Market Research Tools and Resources You Need to Know
-
 6 Competitive Advantage Examples From the Real World
-
 6 Exceptional Brand Messaging Examples We Can All Learn From