
Win/loss analysis is an essential practice for anyone who wants to better understand their competitive landscape and continuously optimize processes across sales, marketing, product management, and beyond.
Why do we win some deals and lose others? How often do we win against Competitor XYZ? How well do we compete in the healthcare vertical?
Asking and answering questions like these — and subsequently taking action based on the conclusions you draw — is a critical piece of the puzzle that is building a successful business.
By the time you’re done reading, you’ll have an answer to each of the following:
- What is win/loss analysis?
- How do you calculate win rate and win/loss ratio?
- How do you conduct win/loss analysis?
Let’s jump in!
Get your free ebook + template: The 3 H's of a Successful Win Loss Project.
What is win/loss analysis?
Win/loss analysis is the process of determining why deals are won or lost. More specifically, it’s the process of evaluating performance against a range of variables — industry, company size, persona, competitor involvement, lead source, etc. — and, from there, making judgements as to why deals are won or lost.
As you can imagine, different organizations execute win/loss analysis for different reasons and in different ways. Whereas a fledgling company in a relatively uncrowded market may be primarily interested in evaluating and improving performance against one specific competitor, an established company in the midst of a complex competitive landscape may be interested in evaluating and improving performance against a number of variables.
Specifics aside, you can think of win/loss analysis as a three-step process: gather data, analyze data, and take action. We’ll explore each of these steps in detail in just a minute, but first, a note on data: Both quantitative and qualitative data can and should be used in the process of determining why deals are won or lost. Let’s take this opportunity to quickly discuss two quantitative datapoints that you’ll find useful as you make the plunge into win/loss analysis.
How to calculate win rate & win/loss ratio
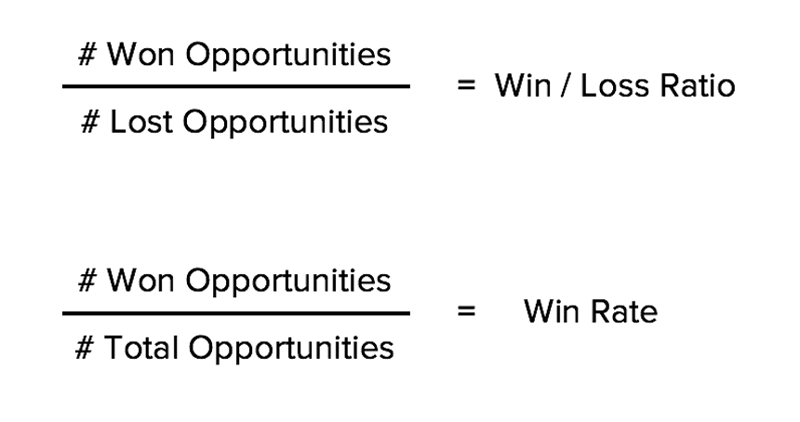
Win rate refers to the rate at which your sales team turns opportunities into customers. It can be calculated by dividing the number of opportunities you’ve won by the total number of opportunities that have been generated. Note that you can evaluate win rate both at a macro level and at a micro level — win rate by industry, win rate by persona, etc.
Win/loss ratio refers to the ratio of won opportunities to lost opportunities. It can be calculated by dividing the number of opportunities you’ve won by the number of opportunities you’ve lost. Note that (1) an opportunity that’s still in progress has neither been won nor lost and (2) you can evaluate, once again, both at a macro level and a micro level — win/loss ratio by company size, win/loss ratio by lead source, etc.
How to conduct win/loss analysis in 3 steps
As we walk through this portion of today’s guide, keep in mind that, again, different organizations execute win/loss analysis for different reasons and in different ways. Although the following three-step process may not be perfect for everyone, it’s a helpful starting point for those who are trying to figure out how they can extract meaning from won and lost deals.
1. Gather your data
First things first: You’ve got to gather the data from which you’ll eventually draw conclusions and initiate action. At a minimum, you need to know the name and owner of each opportunity and whether it was won or lost (or if it’s still in progress). Odds are you’re going to need more than that, and we’ve got some ideas of types and sources of data that you can tap into.
But first, an important note: The types and sources of data you leverage should be informed by your win/loss analysis goals. Ask yourself: What do you want to know, and why? Against which variables do you want to evaluate performance? Are you interested in industry-specific data? Persona-specific data? Competitor-specific data?
Your answers to these questions — and similar ones that you come up with — will guide you towards the types and sources of data you’re looking for. But in the meantime, here’s a handful of ideas to get you started.
Sales data
Assuming your sales reps are diligent individuals, they’re probably jotting down notes about each opportunity within your customer relationship management (CRM) solution. Take a tour through these notes and you’ll find all kinds of useful information related to job titles, seniority levels, pain points, use cases, objections, competitors, and so on.
Prospect & customer feedback
What better way to gather win/loss data than by picking the brains of the individuals who ultimately determine whether you win or lose deals? Interviews with prospects and customers are tremendously valuable because they give you unadulterated access to the minds of decision-makers (or the minds of those who work closely with decision-makers). Sales reps’ notes are great, but if you can go straight to the source, that’s even better.
Firmographic data
Firmographics are sets of characteristics that are used to categorize organizations; they are to organizations as demographics are to people. Some sales reps may include firmographic data in their opportunity notes, but that won’t always be the case. If you’re interested in evaluating performance against industry, location, revenue, company size, company maturity, or any other variable along those lines, firmographic data — often collected via form and housed within your CRM solution — is a must.
Marketing data
When endeavoring to determine why deals are won or lost, it’s often useful to explore trends across the interactions between your prospects and your marketing materials. Using your content management system (CMS), your CRM solution, and any marketing automation tools you may employ, you can segment opportunities by age, traffic source, lead source, content engagement, and so on.
2. Analyze your data
Once you’ve gathered your data — you’ve conducted interviews with prospects and customers, compiled sales reps’ notes from opportunities involving Competitor XYZ, calculated the number of opportunities involving companies from Industry XYZ, etc. — it’s time for analysis. It’s time, in other words, to answer those questions you asked yourself before diving into step one.
You may find it helpful to begin your win/loss analysis at a high level. Calculate your overall win rate, your overall win/loss ratio, and perhaps your overall competitive win rate (i.e., the rate at which you win deals that involve at least one competitor). By beginning with these high-level metrics, you effectively contextualize everything else you’re about to uncover. Say, for example, that you begin your analysis by calculating an overall competitive win rate of 25%. If, later on in your analysis, you were to calculate a win rate against Competitor XYZ of 40%, you’d be able to quickly infer that your sales reps perform particularly well against that specific competitor.
Once you’ve taken care of high-level matters, you can slice and dice the data you’ve gathered against all the different variables you consider important. Again, the variables one considers important will largely depend on goals. Here are a few examples to get the wheels turning.
Common reasons for lost opportunities, according to prospects
Although careful review of qualitative prospect feedback may not be the first thing that comes to mind when you think about slicing and dicing your data, it’s one of the most critical components of the win/loss analysis process.
When you asked your prospects why they decided to buy your competitors’ solutions, what did they say? Perhaps more importantly, what did they not say? It may sound simplistic, but you can learn a ton by taking note of the most and least common reasons for lost opportunities.
And don’t be afraid to get granular! Can you observe anything meaningful when you segment your prospects’ feedback in different ways? What do you notice when you review feedback exclusively from prospects in the banking sector? How about when you review feedback exclusively from prospects who entered your database via paid search advertising?
Common reasons for won opportunities, according to customers
We’re not here to conduct loss analysis — we’re here to conduct win/loss analysis! As such, it’s also worthwhile to carefully review qualitative feedback with respect to the deals you’ve won.
When you asked your customers why they decided to buy your solution, what did they say? What did they not say? You can learn just as much about your business from these responses as you did from your prospects’ responses.
And, again, granularity is nothing to shy away from. Customers in the banking sector may provide feedback that differs considerably from customers in the hospitality sector; customers who entered your database via paid search advertising may provide feedback that differs considerably from customers who entered your database via trade show. No matter what, there’s only one way to find out.
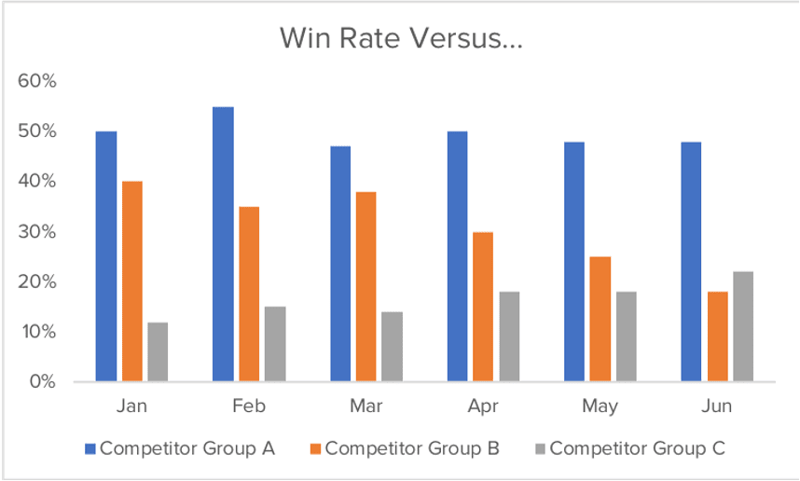
Win rate & win/loss ratio by competitor
If your business is like most businesses in the sense that you’re operating in an increasingly competitive market, it can be difficult to determine which competitors are more or less worthy of your attention. One way to make this determination is to calculate — for each competitor — the rate at which you win deals and the ratio of won opportunities to lost opportunities.
Win rate & win/loss ratio by persona
Your solution exists to assuage a set of pain points. But it shouldn’t be taken for granted that all prospects experience those pain points in the same way — and, therefore, it shouldn’t be taken for granted that all prospects respond to your sales and marketing tactics in the same way. By calculating win rate and win/loss ratio by persona, you can get a sense of how well (or poorly) your approach is resonating with different audiences.
Win rate & win/loss ratio by lead source
You generate leads in order to generate customers. And just as you shouldn’t assume that all prospects experience pain points in the same way, you shouldn’t assume that all lead sources translate into bottom-line results at the same rate. By calculating win rate and win/loss ratio by lead source, you can figure out which types of leads tend to convert into customers — and which ones do not.
3. Take action
Congratulations! At this point, you should have a strong sense of why you win some deals and lose others. Knowledge for the sake of knowledge is cool, but the ultimate purpose of this exercise is to improve performance over time. That’s why taking action is the third and final step in our win/loss analysis process.
Given what you’ve learned, what do you and your colleagues need to do in order to win more deals? Answers to this question, of course, will vary dramatically from one organization to another, but we’ve compiled a handful of common action items that you may need to execute.
Narrow your focus
You may find that your sales team struggles disproportionately with certain types of companies. Whether it’s companies of a certain size, companies of a certain maturity level, companies from a certain sector, or something else along those lines, it’s worthwhile to consider narrowing your focus. If the opportunity cost of pursuing these deals exceeds the potential upside, why bother?
Revisit your personas
Sometimes it’s not certain companies that give sales reps trouble, but rather certain prospects — i.e., certain personas. If that’s the case, one of several factors could be at play. It’s possible that the personas with which your reps struggle are simply unfit for your solution. If, for example, your reps are going after both sales leaders and marketing leaders, and they’re struggling disproportionately with the latter group, one potential explanation is that — for whatever reason — marketing leaders are not the right people with whom to speak about your product or service.
An alternative explanation is that, although marketing leaders are the right people to contact, your reps don’t know enough about them to make a compelling pitch. Either way, the takeaway from your win/loss analysis is that you need to revisit your personas.
Improve your competitive battlecards
Maybe your reps struggle neither with certain companies nor with certain personas, but rather with certain competitors. Again, this could be true for a number of reasons. Whereas one competitor may do an excellent job of positioning their solution as a superior alternative to yours, another may do an excellent job of incentivizing prospects with discounts.
Whatever the case may be, if you find that performance takes a dive when particular rivals enter the equation, improving your competitive battlecards is likely the best way forward. If you can arm your reps with real-time, contextualized intelligence and ready-made conversational tactics, they’ll be better equipped to get deals across the finish line.
Tweak your product roadmap
This final action item, should you find that it’s warranted, is less likely to be based on quantitative data and more likely to be based on qualitative data — specifically the feedback you receive from prospects who decided to buy an alternative solution. As you comb through their responses, you may realize that your product roadmap is not as aligned as it should be with the demands of the market.
Let’s say, for example, that your company sells email marketing software. As you review your interviews with prospects, you notice that the most common reason for lost deals is the lack of depth offered by your analytics tools. Well, if improvements to your analytics tools are absent from your product roadmap, that’s clearly an issue. If it’s important to you and your colleagues to win deals at a higher rate, that roadmap is going to need some work.
Using win/loss analysis to crush the competition
According to the 2021 State of Competitive Intelligence Report, 84% of businesses say their markets are increasingly crowded and 53% say the majority of their sales deals are competitive. Now more than ever, it’s critical to understand both why you win and why you lose.
Why do we say that? Because with that understanding comes the ability to consistently make smart decisions. When you know how well or poorly you perform against certain variables, you’re better equipped to steer your organization in the right direction. Whether that means doubling down on a specific sector, rethinking the language you employ when communicating with prospects, or investing in competitive intelligence, you’re far less likely to make a misstep when the data is on your side.
And as the intensity of competition rises, so, too, does the price of a misstep.


Seeing is believing! Check out Crayon for yourself.

Related Blog Posts


Popular Posts
-
 Sales Battlecards 101: How to Help Your Sellers Leave the Competition In the Dust
-
 How to Create a Competitive Matrix (Step-by-Step Guide With Examples + Free Templates)
-
 The 8 Free Market Research Tools and Resources You Need to Know
-
 6 Competitive Advantage Examples From the Real World
-
 6 Exceptional Brand Messaging Examples We Can All Learn From